BTC/USDT 64,210.5 +1.84% ETH/USDT 3,118.20 +0.92% SOL/USDT 147.65 −2.11% BNB/USDT 588.40 +0.34% XRP/USDT 0.5241 −0.77% AVAX/USDT 27.91 +3.05% DOGE/USDT 0.1492 +1.20% LINK/USDT 14.07 −1.43% BTC/USDT 64,210.5 +1.84% ETH/USDT 3,118.20 +0.92% SOL/USDT 147.65 −2.11% BNB/USDT 588.40 +0.34% XRP/USDT 0.5241 −0.77% AVAX/USDT 27.91 +3.05% DOGE/USDT 0.1492 +1.20% LINK/USDT 14.07 −1.43%
crypto setup scanner · data-audited

The scanner that routes your attention, not your trades.

Scans ~200 crypto tickers and, for every chart pattern, tells you what it actually does on today's markets — follow, fade, or wait for the break. Measured from data, not TA lore.

Create an account — it's free See how it works
8 timeframes · 1m→1d ~200 tickers 94 patterns
BTC/USDT · 15m 64,210.5 ▲
// ascending triangle · WATCH
order book
64,2210.84
64,2180.61
64,2150.42
64,210.5spread 4.5
64,2060.55
64,2030.73
64,2000.97
odds
P(tgt)0.62
R:R2.4
EV+0.38R
streamed straight from the exchange BINANCE COINBASE KRAKEN BYBIT OKX
// pipeline

From candle to call, in four layers

Each layer does one job and hands off over an internal message bus. The final call stays human.

01
detect

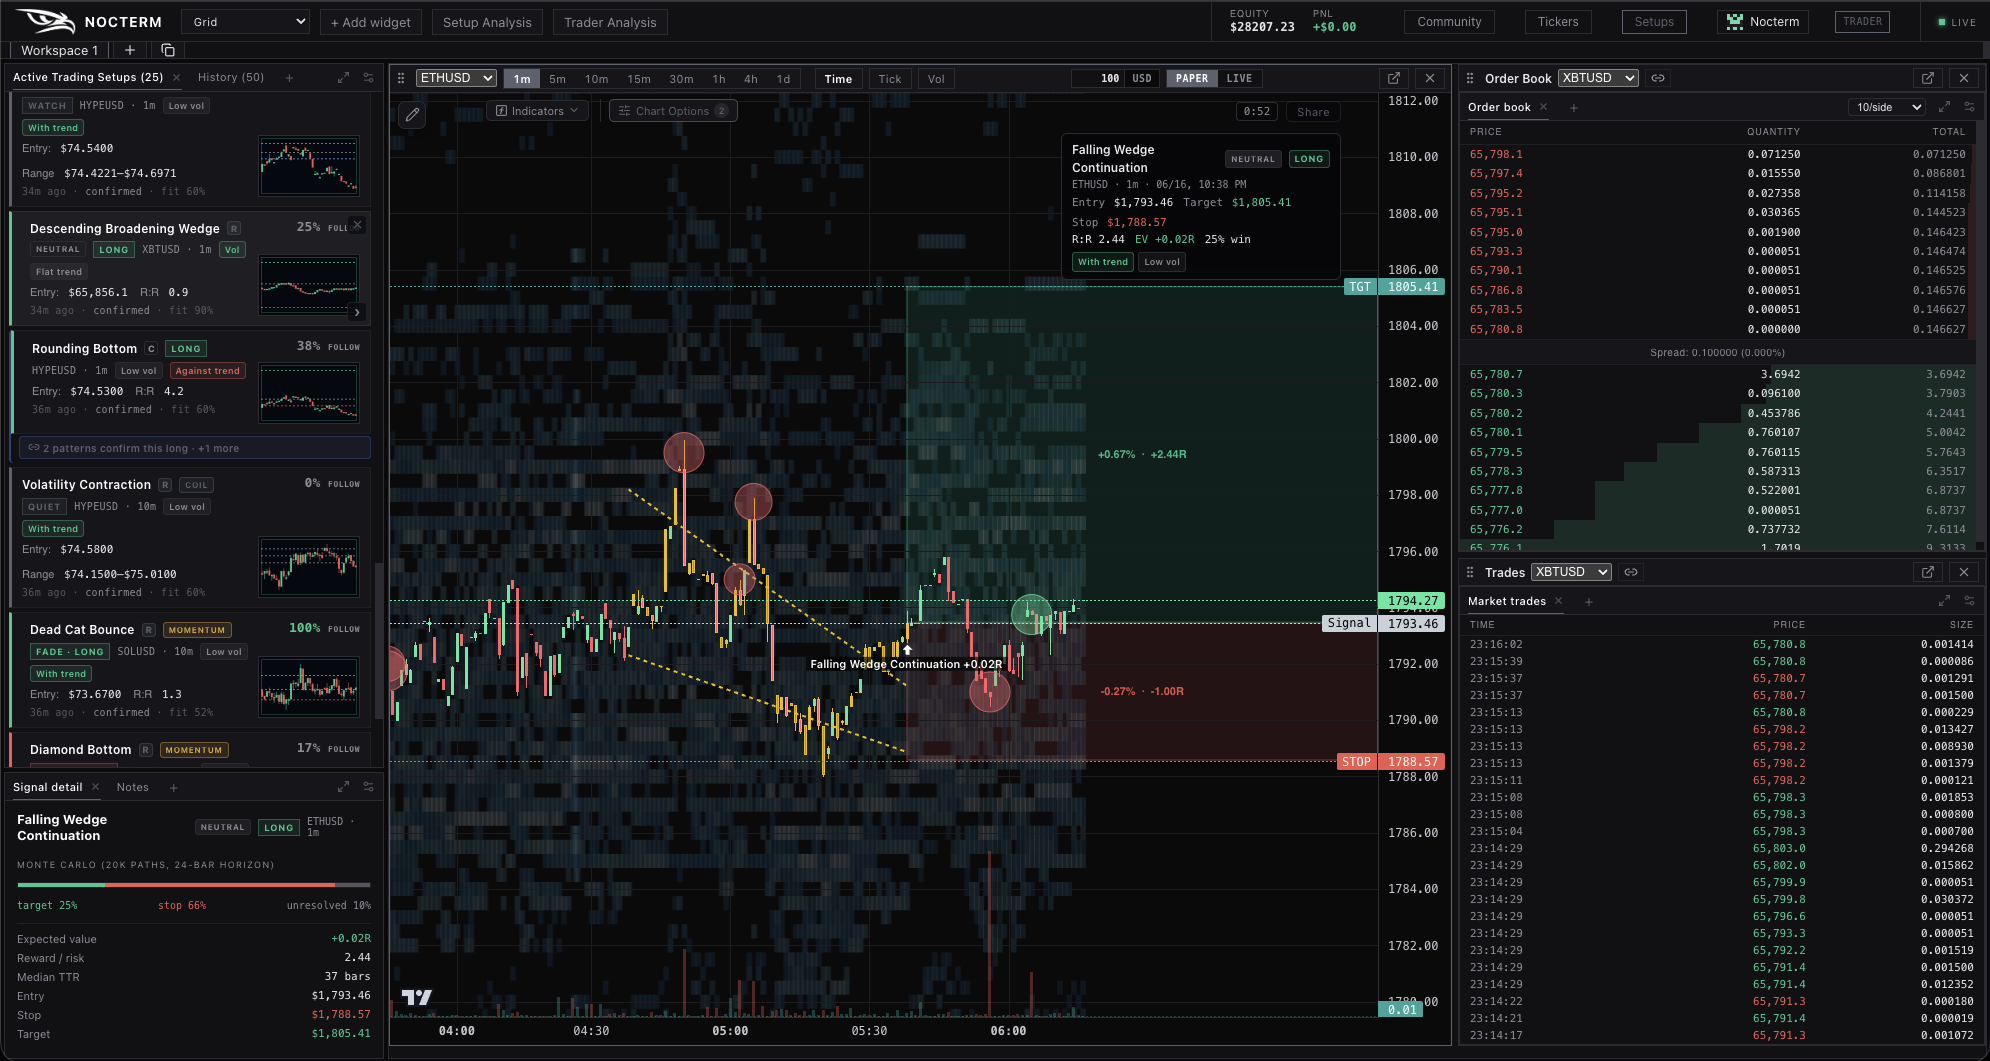
Surface the candidate

Detectors run on every closed bar across 8 timeframes, drawing each pattern's geometry and defining entry, target, and stop.

02
classify

What does it actually do?

Each pattern carries a data-audited play — follow, fade, or watch the break — based on how it behaves on current liquid markets.

03
score

Grade the geometry

A barrier-touch Monte-Carlo engine scores P(target before stop), reward:risk, EV, and time-to-resolve against the asset's volatility.

04
decide

You make the call

Direction conviction and the final go/no-go are yours. The scanner filters bad geometry; it never makes a weak setup good.

// capabilities

Everything in one cockpit

// scanner

The ranked watchlist

Every tracked symbol, scored and sorted. Each row shows the live pattern, its measured play, and the odds — so your attention lands on the few setups worth acting on.

Sort by EV, R:R, or freshness
Follow / Fade / Watch badge per row
One click jumps to the chart
scanner.png
preview
barrier-touch odds engine
P(target before stop)0.62
reward : risk2.4 R
expected value+0.38 R
median time-to-resolve14 bars
// odds

Pure geometry, no prediction

A Monte-Carlo engine grades each setup's shape against the asset's own volatility: probability of hitting target before stop, R:R, EV in R, and median bars-to-resolve. It's math, not a forecast.

// order flow

The Candle Heatmap

Our own candles, painted with order flow. Each bar is a heat box: green where buyers hit, red where sellers did, and the brighter the band the bigger the size. See where in a candle the volume actually traded — at a glance.

Aggregate volume or only the largest trades
Absolute scale — brightness means real size
Split buy/sell cells & fully recolorable
candle-heatmap
chart.png
preview
// chart

Charting with the full flow stack

Eight timeframes with pattern geometry and signal markers drawn on the chart — then layer the microstructure: footprint, order-flow field, fragility bands, a Bookmap-style liquidity heatmap, volume profile, large-trade bubbles, and an expected-range volatility cone.

1m → 1d, zoom-to-setup, pattern geometry
Footprint · flow field · fragility · liquidity heatmap
Volume profile · trade bubbles · volatility cone
// analytics

Know your own edge

Setup analysis and trader analytics show which patterns you actually act on, your win-rate by play, and the outcome of every signal — tracked and stored so you can audit yourself, not just the market.

Win-rate by play and pattern
Signal outcome tracking & history
Exportable, per-account
analytics.png
preview
// PAPER

Paper & prop sim

Your own mock account — market & limit orders, auto SL/TP, live mark-to-market PnL — with optional prop-style max-drawdown and daily-loss limits that latch on a breach.

// ALERT

Alerts that pass the gate

Only setups clearing your EV / R:R / win-rate thresholds reach you. Tune the gate; ignore the noise.

// LIVE

Live trading

Connect a desktop client and route real orders to the exchange from the same cockpit — setups, odds, and order flow right beside the ticket.

// TAPE

Cross-sectional tape

The whole tracked universe's aggressive flow at a glance — which symbols are getting hit, and where the pressure is rotating, before it shows on the chart.

// RECLASSIFY · plays, not labels

Every charting tool says a bull flag is bullish. We measured it — intraday, the textbook breakout fades. So each pattern ships with a play proven on the current market.

Follow
Continuation confirmed — trade the textbook direction.
Fade
Momentum exhausts — the data says take the other side.
Watch
No edge yet — wait for the break before committing.
// pricing

Start free. Scale when the edge is yours.

No card to start. The full three-layer scanner runs on the free tier.

Scout
$0/ forever

The full three-layer scanner for one watchlist. Built to prove the edge is yours.

Get started
Up to 5 watchlist symbols
All 8 timeframes (1m → 1d)
Odds-engine scoring on every signal
One paper-trading account
Live order book & trade tape
Most popular
Trader
$10/ month

For the active discretionary trader who wants the alerts and the analytics.

Start free trial
Up to 30 watchlist symbols
Everything in Scout
Phone alerts, gated by EV / R:R / win-rate
Setup analysis & trader analytics
Signal outcome tracking & history
Priority real-time feed · email support
Desk
$25/ month

Maximum coverage and headroom for power users running large watchlists.

Get started
Up to 50 watchlist symbols
Everything in Trader
Priority real-time market feed
Multiple paper-trading accounts
Configurable alert routing
Live trading via desktop · priority support
// start scanning

Point it at the market.

Create an account and start scanning setups in seconds. No card required.

Get started — it's free