Everything in one cockpit
Reclassified by real edge
Textbook TA says a bull flag is bullish. We backtested every pattern out-of-sample — and plenty do the opposite. Nocterm re-grades each one by what it actually does, then lets you read any setup through both the Classic (textbook) and Reclassified (measured) lens.
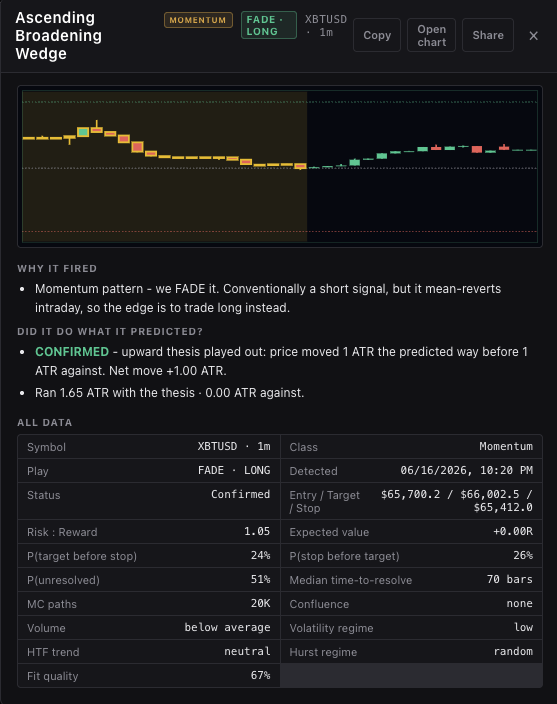
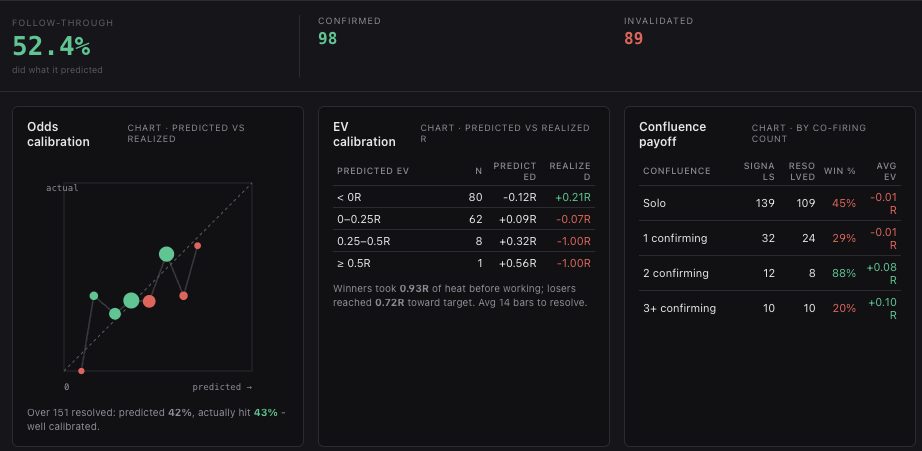
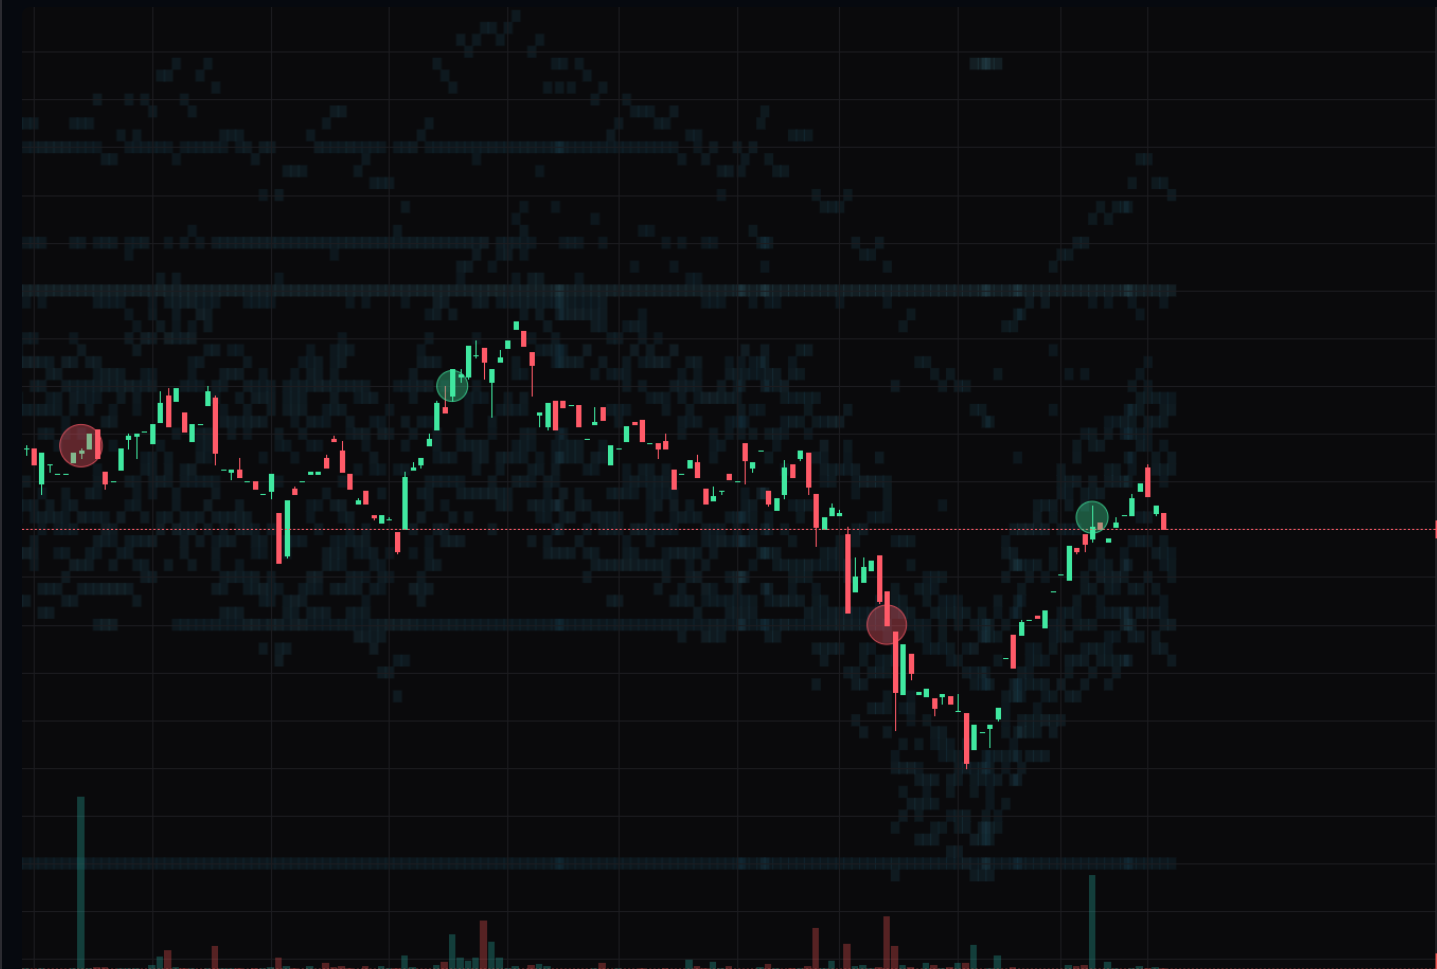
Chart Setup Detection
A detector watches every tracked symbol across eight timeframes and flags 100+ classical chart & candlestick patterns the moment they complete — geometry, trigger, target and stop drawn on the chart. Each one arrives pre-graded against the asset's own volatility: probability of target before stop, R:R, and expected value. It's math, not a forecast.
The Candle Heatmap
Our own candles, painted with order flow. Each bar is a heat box: green where buyers hit, red where sellers did, and the brighter the band the bigger the size. See where in a candle the volume actually traded — at a glance.
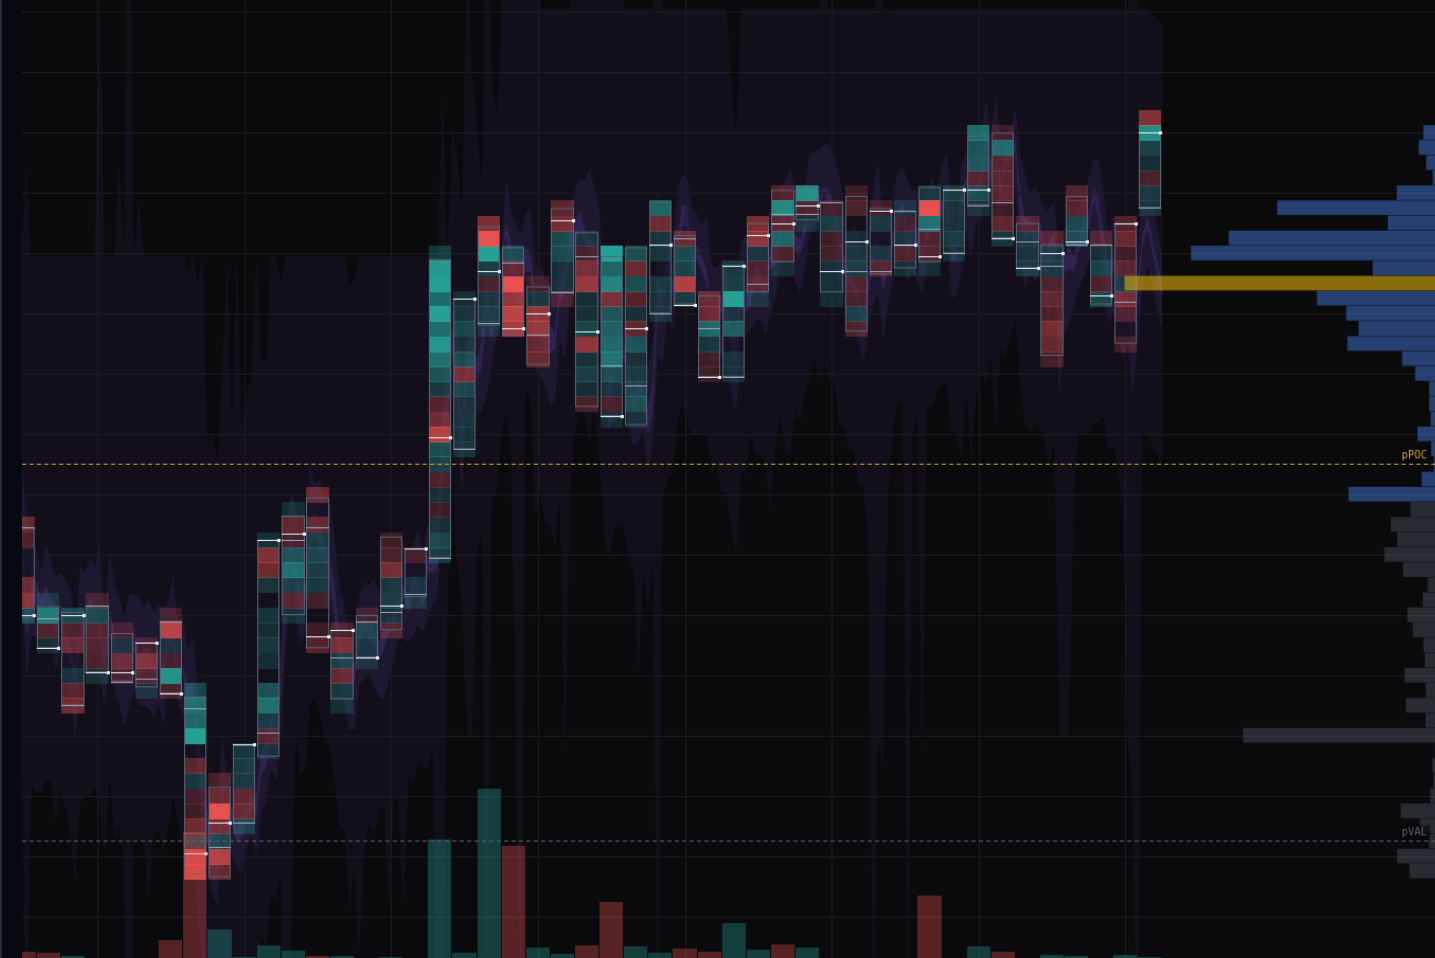
Charting with the full flow stack
Eight timeframes with pattern geometry and signal markers drawn on the chart — then layer the microstructure: footprint, order-flow field, fragility bands, a Bookmap-style liquidity heatmap, volume profile, large-trade bubbles, and an expected-range volatility cone.
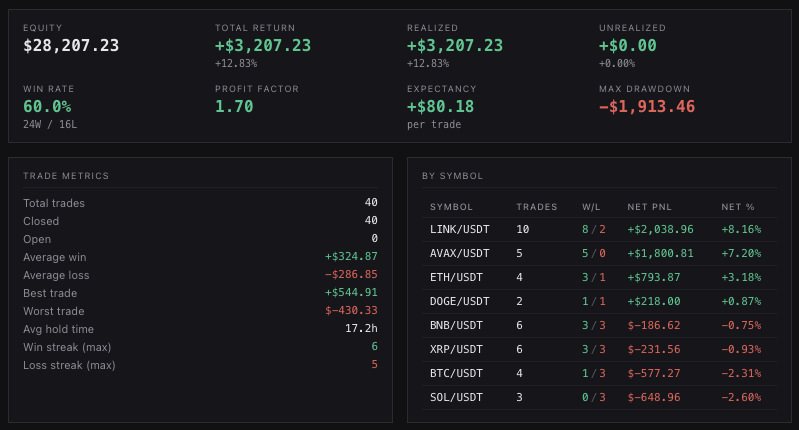
Know your own edge
Setup analysis and trader analytics show which patterns you actually act on, your win-rate by play, and the outcome of every signal — tracked and stored so you can audit yourself, not just the market.
Paper & prop sim
Your own mock account — market & limit orders, auto SL/TP, live mark-to-market PnL — with optional prop-style max-drawdown and daily-loss limits that latch on a breach.
Alerts that pass the gate
Only setups clearing your EV / R:R / win-rate thresholds reach you. Tune the gate; ignore the noise.
Live trading
Connect a desktop client and route real orders to the exchange from the same cockpit — setups, odds, and order flow right beside the ticket.
Cross-sectional tape
The whole tracked universe's aggressive flow at a glance — which symbols are getting hit, and where the pressure is rotating, before it shows on the chart.
Put it all on one screen.
Spin up a workspace and lay these tools out however you trade. Nothing to install — it runs in the browser.
Open the terminal